


A comprehensive overview of the democratic primary contenders
OK, as the field of contenders is forming, I thought I gather all the data available and post it in one post to have it all together. It is probably incomplete, has the wrong methodology and most likely is unfair to your favorite candidate and shows your most hated candidate in a way too good light. Do it better!
I include my sources as links and also link the download of the gnumeric spreadsheet I used to collect the data.
The field
First off, an overview of the field:
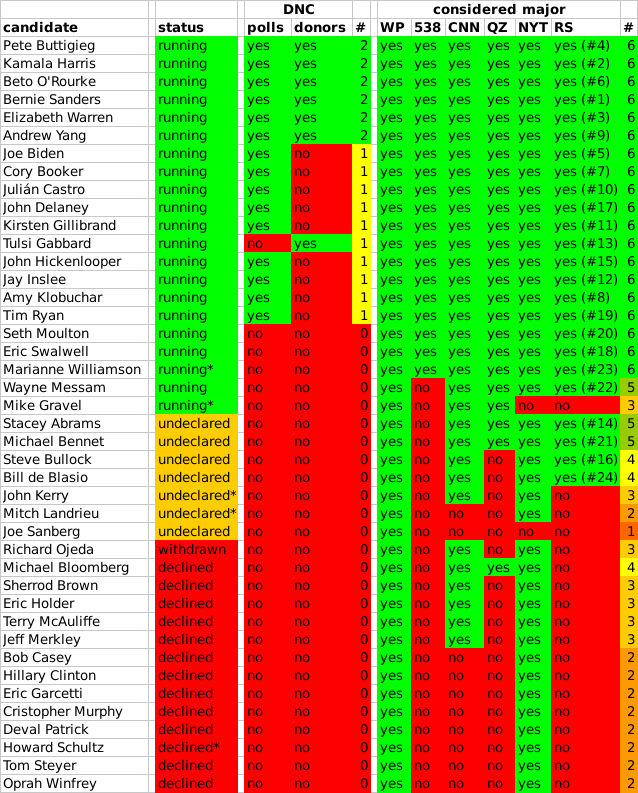
This table has all candidates, who are considered by at least one of these six as major: Wikipedia, FiveThirtyEight, CNN, Quartz, New York Times and Rolling Stones. The exception is, I included declined candidates only, if they were named more than just by Wikipedia, otherwise it would've been too many.
Only Wikipedia and 538 have given a definition of major, the others probably are subjective.
Wikipedia-definition of major: In addition to having filed with the Federal Election Commission to run for president in the Democratic Party primary in 2020 and having confirmed this by an official campaign announcement, the major candidates in this table below have either: ( a ) held public office; ( b ) been included in a minimum of five independent national polls; or ( c ) received substantial media coverage.
The 538-definition of major includes all candidates qualifying for the debates by the criteria set by the DNC (either one) and additionally candidates for which at least six out of ten questions can be answered with yes. Look at the article for the questions and more details.
Rollign Stones has a ranking of the candidates. I see no criteria for this ranking, so it is probably subjective. I include this purely for information.
In the above table I marked some candidates with stars. The meaning is:
- Marianne Williamson: Quartz lists her campaign as exploratory, which is outdated.
- Mike Gravel: CNN lists him as undeclared
- John Kerry and Mitch Landrieu: Wikipedia lists them as declined
- Howard Schultz: might run as an Independent
I list the candidates fullfillment of the DNC-criteria for the first debates. The source for this is 538.
I ordered the above list according to following criteria:
- Status: running, exploring (currently no one), undeclared, withdrawn, declined
- DNC criteria: fullfiled both, one or none
- number of media considering the candidate as major
- alphabetical
Endorsements
So far I only see FiveThirtyEight ranking endorsements. You might dislike their methodology, but they are the only ones I know of making such ranking at all. If you know of more endorsement trackers, please let me know.
Their methodology is basically to pick certain positions (like past presidents, senators, house representatives, DNC chairs) and appoint a point value to their position. For instance a US senator is worth six points and a US representative 3 points. These points are added up. The pool of possible endorsers is limited this way, overall 2,256 points are up for grabs. So far 14.6% of the points are gained by one candidate or the other. I lists the points and the percentages of the overall pool in this graphic.
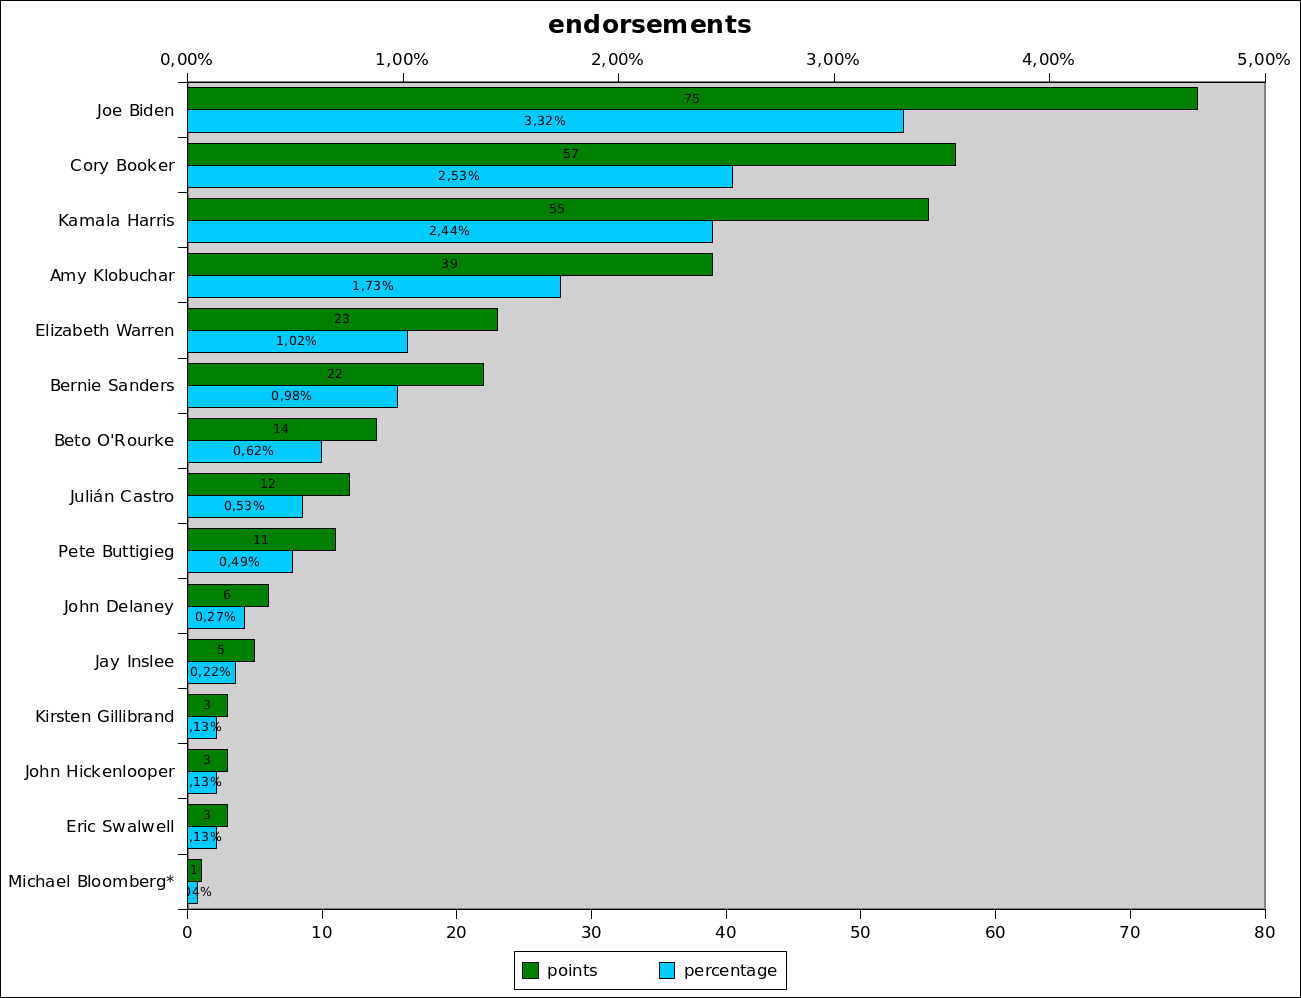
Michael Bloomberg declined to run, after he got the endorsement.
Look at the source, to see the endorsers in detail.
Fundraising
Wikipedia has a fundraising table with the FEC-data filed for the quarter ending March 31st. This is the Wikipedia-table sorted by fundraising total.
You should note with this data, that some candidates transferred money from former campaigns or are strongly self-funded (Delaney).
I have transformed the data into a graph of the fundraising total and the percentage of small dollar donations.
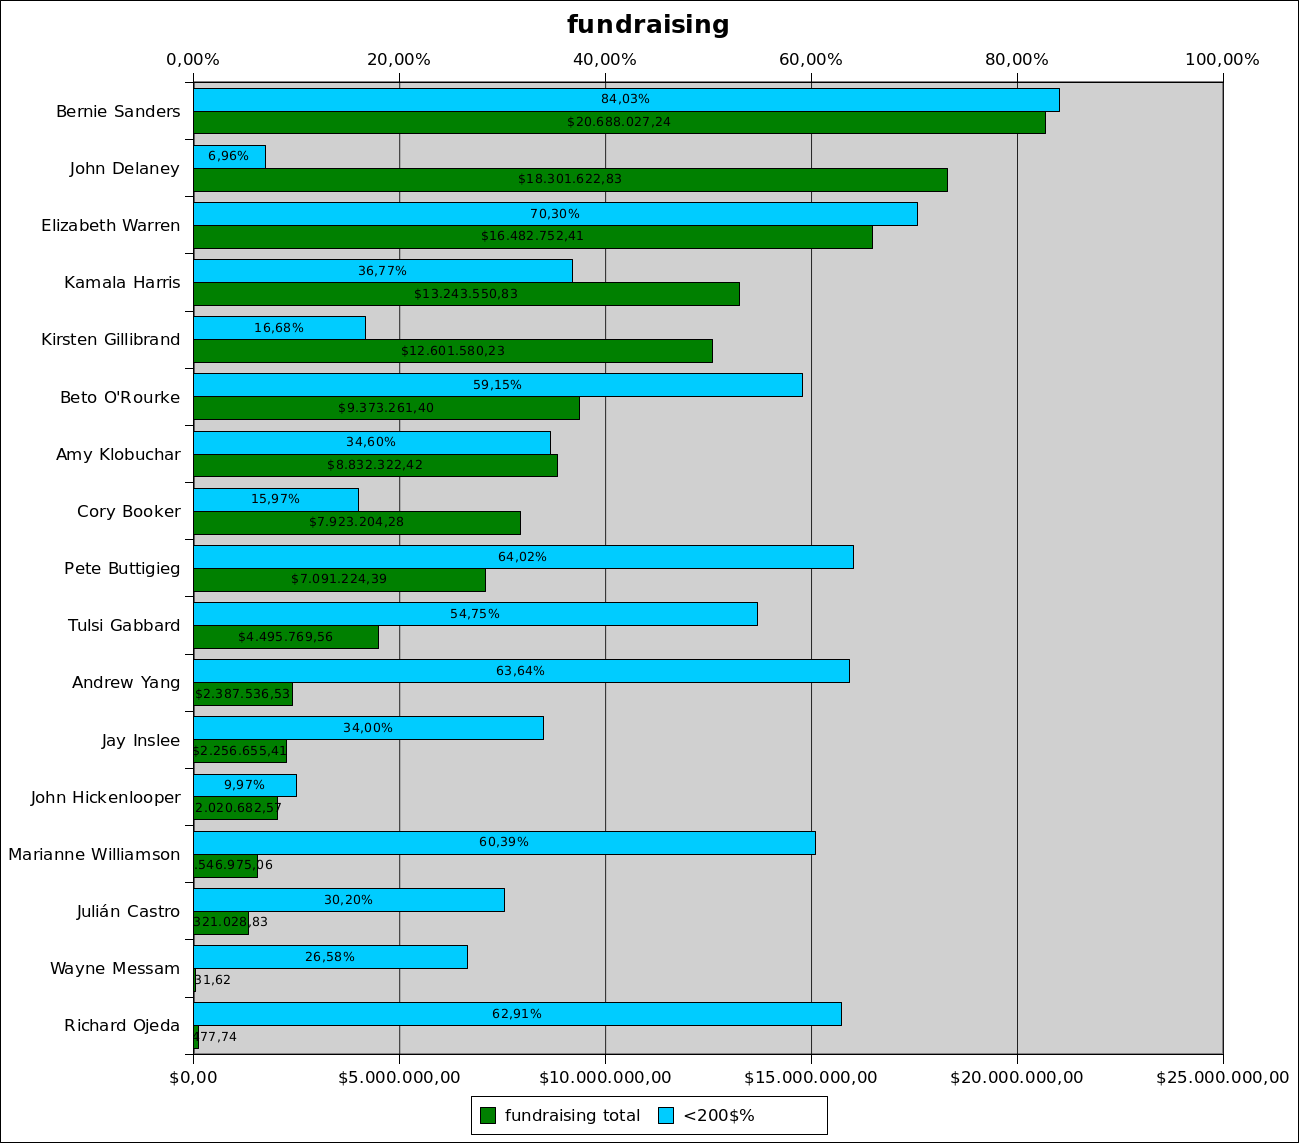
Note that Richard Ojeda dropped out of the race.
Social Media
Quartz was nice enough to collect data about social media followers of the candidates profiles.
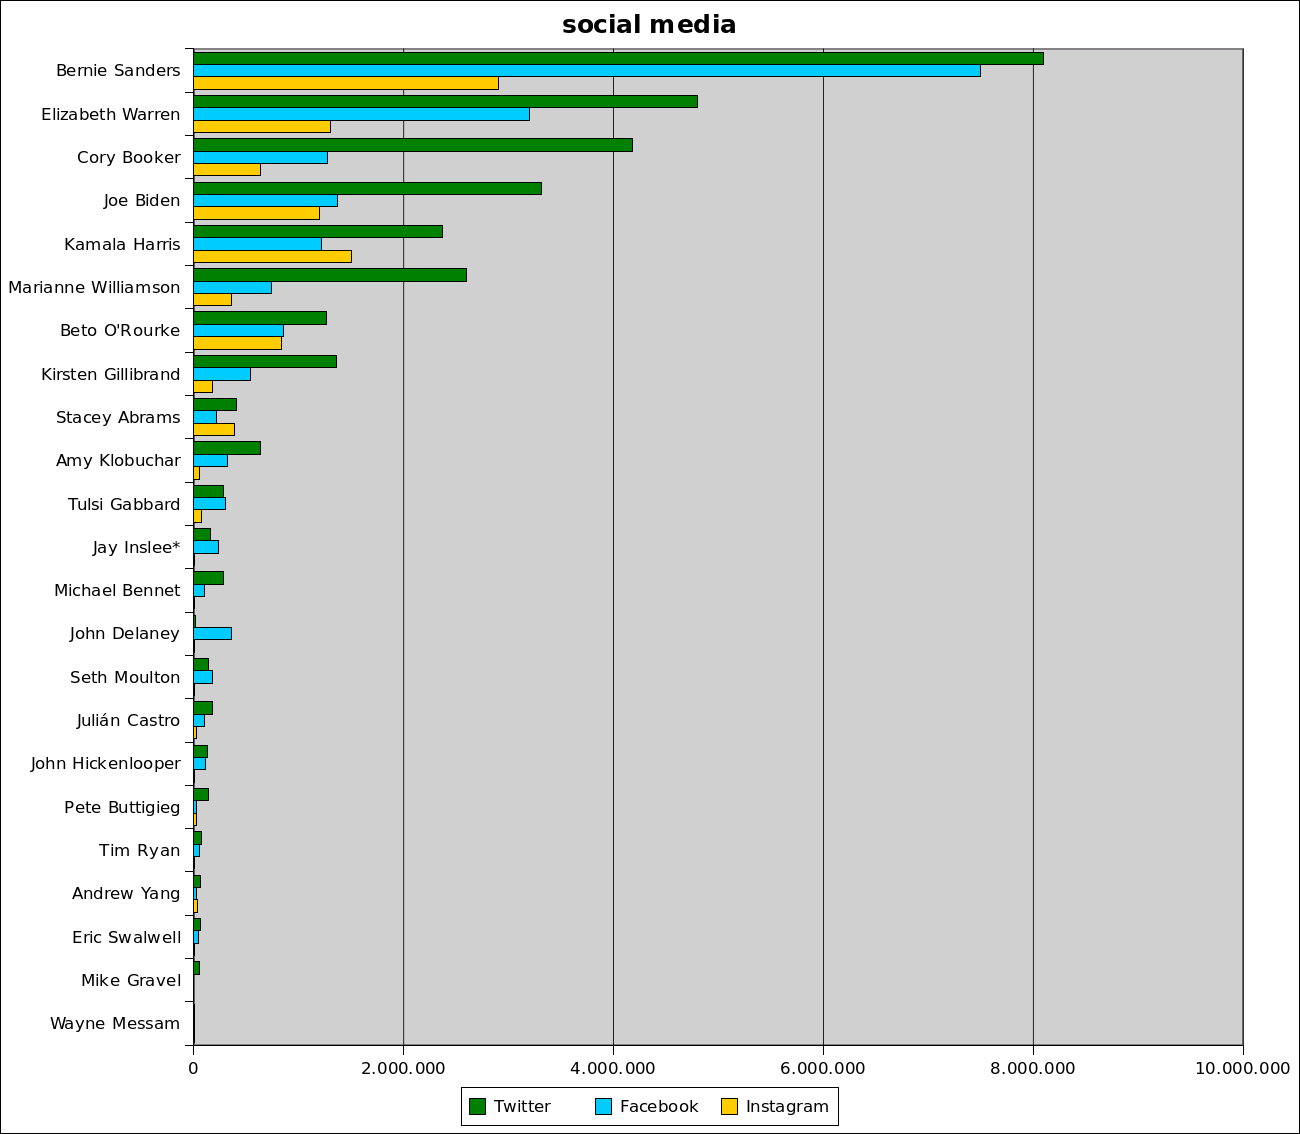
One note here for Jay Inslee: Quartz counted the followers for his personal Facebook page (125,000) and his page as gouvernor (110,000). I added both for the above chart.
Cable news coverage
FiveThirtyEight tracks coverage of the candidates in cable news. They do regularly articles about that. The linked one is the last. I show their very informative graphic here, but follow the link to the article for more information.

Polls
Well, polls are obviously among the most important data. As there are a lot of pollsters it is quite difficult to get an overview. I found in the web only RealClearPolitics creating an average (follow the link for a view of developments over time). So I took myself recent polls from the 538-database of polls and created an weighted average myself (more explanations after the graph).
Not included directly in the graph (but indirectly, because both RCP average and my weighted average include it) is Morning Consult. Their overview is also quite informative.
The following graph has the weighted average I made and the RCP average:
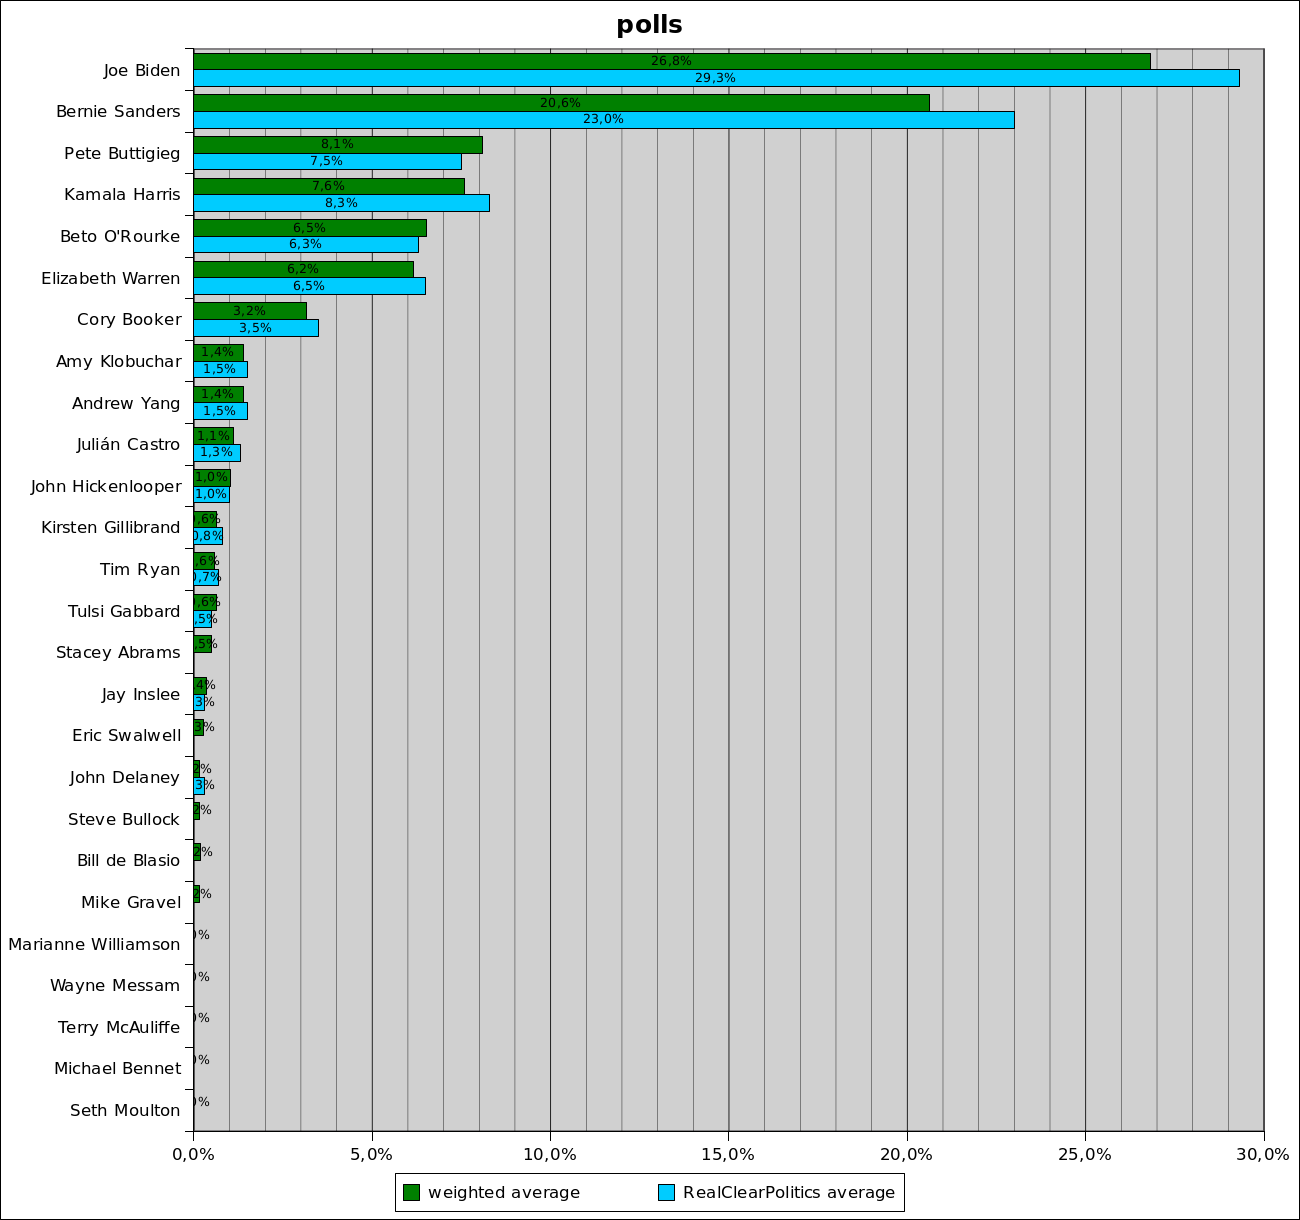
So how did I do the weighted average? I picked from the list of national polls the ones conducted in April. If a pollster took multiple polls I only included the most recent. Change Research and Monmouth University both asked with Biden included and excluded. As Biden declared since, I picked the poll with Biden.
Following that criteria, I picked 7 polls from Ipsos, Morning Consult, Change Research, Monmouth University, USC Dornsife/LA Times, Emerson College and HarrisX. 538 has a pollster ranking, I weighted the poll based on that ranking with D- as 0.5 and A+ as 1.6 and everything in between a 0.1 step apart. With this weights I made an weighted average.
What else?
I would like to include data about the ground game, so the number of paid staff and the number of volunteers. But I can't find something reliable over the majority of the field, so this is missing.
If you find errors or have additions, please feel free to inform me.
Last edited by Mnementh - on 27 April 2019